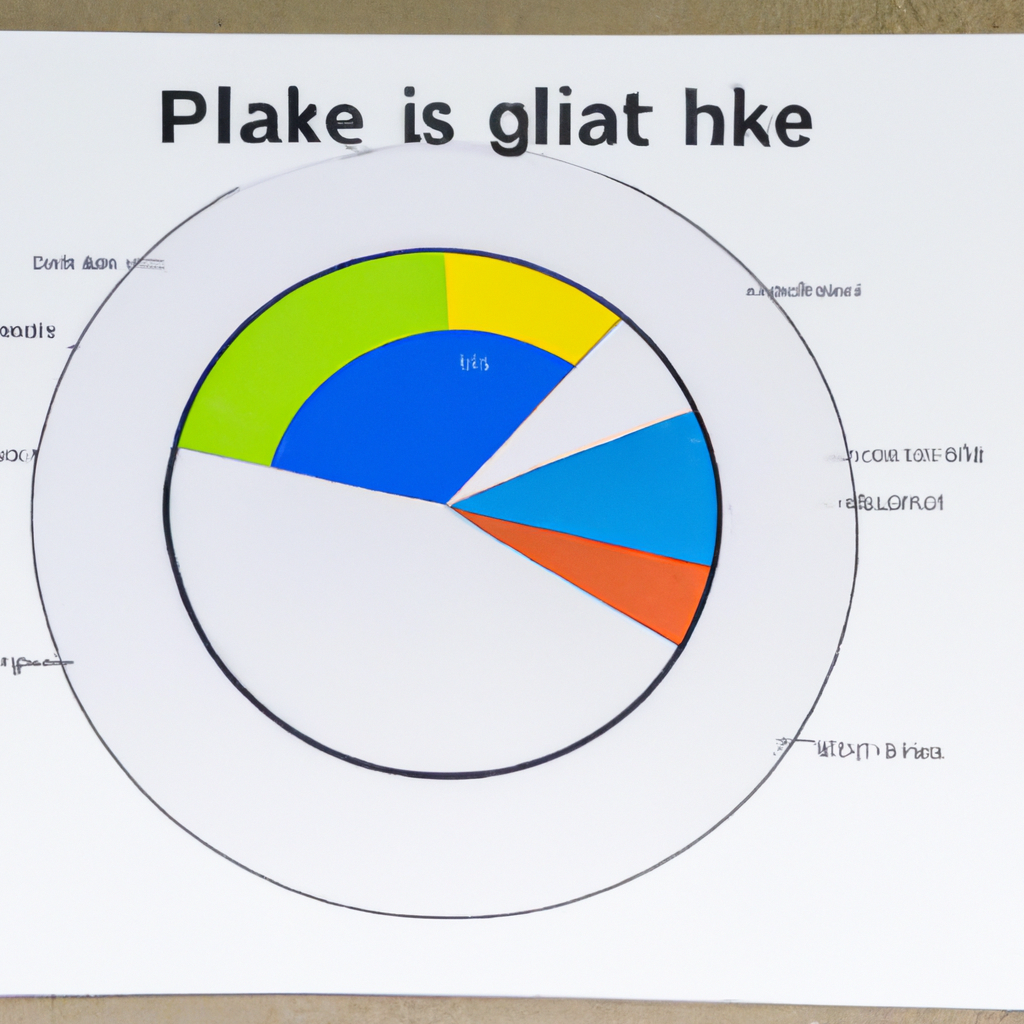
How to Make a Pie Chart in Google Slides
Introduction
Google Slides is a powerful presentation tool that allows you to create visually appealing charts to enhance your presentations. Pie charts are an effective way to represent data in a visually engaging and easily understandable manner. In this article, we will guide you through the process of creating a pie chart in Google Slides.
Step-by-Step Instructions
- Open Google Slides and create a new presentation or open an existing one.
- Select the slide where you want to insert the pie chart.
- Click on the “Insert” tab in the menu bar and select “Chart”.
- A sidebar will appear on the right-hand side of the screen. Choose the “Chart type” dropdown menu and select “Pie”.
- Click on the “Data” tab within the chart editor sidebar.
- Enter your data in the provided table or import it from a Google Sheets document using the “Import” button.
- Customize the appearance of your pie chart by selecting the “Customize” tab.
- Modify the chart’s colors, labels, fonts, and other settings to match your preferences.
- Once you are satisfied with the chart, click on the “Apply” or “Update” button to insert it into your slide.
- You can further resize and reposition the chart by clicking and dragging its edges or corners.
- Finally, remember to save your presentation by clicking on the “File” menu and selecting “Save” or “Save As”.
Tips and Tricks
Here are a few additional tips to help you create stunning pie charts in Google Slides:
- Consider using a limited number of slices to avoid overwhelming your audience with information.
- Use contrasting colors for each section of the pie to ensure readability.
- Add labels or percentages to make it easier for viewers to interpret the chart.
- Experiment with different chart styles and options to find the best representation for your data.
- Remember to keep your data accurate and up-to-date.
With these simple steps and helpful tips, you are now equipped to create impressive pie charts in Google Slides and enhance your presentations. Happy charting!
